Posts Tagged ‘bridges’

Road To Disaster

July 2, 2009

Last week, Secretary of Transportation Ray LaHood recommended that congress delay the passage of a new transportation bill, that is due to expire on September 30, 2009, for 18 months. The day before LaHood’s announcement, Congressman James Oberstar (D-MN), chairman of the House Transportation and Infrastructure Committee, announced that his committee’s draft of the new bill would be released on Thursday of that week. And it was!

Oberstar made it plain in an interview by major networks, that delaying the bill was not acceptable; that the situation had been studied and analyzed for years; that the proposed new bill took over two years to draft.
To study the situation for another 18 months will do only one thing, delay the passage of a desperately needed new Highway bill. Why is this desperate attempt being made to delay its much-needed passage? Because there is an election between now and then and this bill is asking for an increase in revenue generation to pay for the cost of this program.

Tax-increase avoidance is the motivating factor that will temper everything that happens until that election is over. Meanwhile, we will be faced with the accelerated deterioration of our transportation infrastructure, an increase in national debt and a decrease of highway safety. Throwing $13 to $18 billion in the pot to “pay for the delay” will ultimately cost you and I many times this amount in attempts to catch us up to the rest of the world.

Think about this: you are standing still, sitting in your broken-down, 20-year old jalopy when a new, sleek super-sporty Ferrari screeches by at twice the speed your vehicle was capable of even brand spanking new. You sit and wait 18 minutes before you even attempt to start catching it. What do you think your chances are of catching and passing it?

That’s our commerce in the jalopy and China’s in the Ferrari…

The Transportation Construction Coalition (TCC), co-chaired by the American Road & Transportation Builders Association (ARTBA) and the Associated General Contractors (AGC) of America, includes 28 national associations and labor unions with a direct market interest in the federal transportation programs and focuses on the federal budget and surface transportation program policy issues, released an important study yesterday that you need to read. Before you do, remember millions of Americans will soon take to the roads over the Fourth of July weekend, and even with our depressed economy there will be a lot more people on the roads than normal and the hazards of travel will skyrocket. This new study shows that many may be driving on deficient highways and bridges ripe for safety improvements. With legislation pending for reauthorization of the nation’s transportation funding, TCC members are calling on Congress to provide significant, dedicated funding for roadway safety improvements and to develop programs that encourage states to invest even more.

“The battle on this bill is shaping up on how you fund it,” said Matthew Jeanneret, spokesman for ARTBA. Jeanneret called the report “somewhat groundbreaking.”

“These are tangible things that can be done to save 22,000 lives a year,” he said. “Imagine if a plane with 200 people on board was crashing every three days. Something would be done about it.”

New Study Shows More Forgiving Roads Would Save Lives And Cut Costs; Health Experts & Transportation Leaders Urge Congressional Action

More than half of U.S. highway fatalities are related to deficient roadway conditions – a substantially more lethal factor than drunk driving, speeding or non-use of safety belts according to a landmark study released today. Ten roadway-related crashes occur every minute (5.3 million a year) and also contribute to 38 percent of non-fatal injuries, the report found.

In revealing that deficiencies in the roadway environment contributed to more than 22,000 fatalities and cost the nation more than $217 billion annually, the Pacific Institute for Research and Evaluation (PIRE) concluded that making the roadway environment more protective and forgiving is essential to reducing highway fatalities and costs.

“If we put as much focus on improving road safety conditions as we do in urging people not to drink and drive, we’d save thousands of lives and billions of dollars every year,” principal study author Dr. Ted Miller said. Miller, an internationally-recognized safety economist with PIRE added, “Safer drivers and safer cars remain vitally important, but safer roadways are critical to saving lives, preventing injuries and reducing costs.”

Titled “On a Crash Course: The Dangers and Health Costs of Deficient Roadways,” the study found the $217 billion cost of deficient roadway conditions dwarfs the costs of other safety factors, including: $130 billion for alcohol, $97 billion for speeding, or $60 billion for failing to wear a safety belt. Indeed, the $217 billion figure is more than three-and-one-half times the amount of money government at all levels is investing annually in roadway capital improvements – $59 billion, according to the Federal Highway Administration.

The report concluded that roadway related crashes impose $20 billion in medical costs; $46 billion in productivity costs; $52 billion in property damage and other resource costs; and $99 billion in quality of life costs which measure the value of pain, suffering, and loss of enjoyment of life by those injured or killed in crashes and their families. The report also found that crashes linked to road conditions cost American businesses an estimated $22 billion at a time when many firms are struggling. According to the report, crashes linked to road conditions cost taxpayers over $12 billion every year.

“Recent concerns about swine flu pale in comparison to the number of crash victims I treat,” said Dr. Jared Goldberg, an emergency room physician in Alexandria, VA. “In medical terms, highway fatalities and injuries have reached epidemic proportions, and efforts to prevent further spread of this plague are essential. In the absence of a true vaccine to defend ourselves, fixing dangerous roads would help prevent traffic crashes from occurring in the first place.”

On a Crash Course identifies ways transportation officials can improve road conditions to save lives and reduce injuries. For example, immediate solutions for problem spots include: replacing non-forgiving poles with breakaway poles, using brighter and more durable pavement markings, adding rumble strips to shoulders, mounting more guardrails or safety barriers, and installing better signs with easier-to-read legends. The report also suggested more significant road improvements, including: adding or widening shoulders, improving roadway alignment, replacing or widening narrow bridges, reducing pavement edges and abrupt drop offs, and clearing more space adjacent to roadways.

“Although behavioral factors are involved in most crashes, avoiding those crashes through driver improvement requires reaching millions of individuals and getting them to sustain best safety practices,” continued Miller. “It is far more practical to make the roadway environment more forgiving and protective.”

The report also analyzed crash costs on a state-by-state basis. The 10 states with the:

• Highest total cost from crashes involving deficient road conditions are (alphabetically): Alabama, California, Florida, Georgia, Illinois, New York, North Carolina, Pennsylvania, Tennessee and Texas.

• Highest road-related crash costs per million vehicle miles of travel are: Alabama, Arkansas, Hawaii, Idaho, Kentucky, Louisiana, Mississippi, South Carolina, Tennessee and West Virginia.

• Highest road-related crash costs per mile of road are: California, Connecticut, District of Columbia, Florida, Hawaii, Maryland, Massachusetts, New Jersey, New York and South Carolina.

This is a link to the report with all its details and statistics.

Take the time and read this report. Even if you don’t drive or have a car, your life is tied to the pavements that link every aspect of our lives. Without our transportation system we would not be what we are.

Note: PIRE is a leading independent transportation safety research organization. It has conducted research for a range of organizations, including the National Highway Traffic Safety Administration, Insurance Institute for Highway Safety, National Safety Council and Mothers Against Drunk Driving (MADD). Drawing upon the most recent available data from the U.S. Department of Transportation, PIRE employed analytic modeling methods to evaluate the causes and costs of U.S. motor vehicle crashes in preparing On a Crash Course.


PIRE conducted the study on behalf of the TCC, which hosts the full report, complete state-by-state data and other research findings at http://www.transportationconstructioncoalition.org/.

Greg Sitek
Ohio’s Infrastructure Receives A Grade Of C-

May 27, 2009

The Ohio Council of Local Sections of the American Society of Civil Engineers’ (ASCE) recently released 2009 Ohio Infrastructure Report Card gives that state’s infrastructure a grade of C-.

The report graded the current condition of 10 infrastructure areas that are essential to the state’s economic prosperity and quality of life. Areas graded are aviation, bridges, dams, drinking water, electricity, parks and recreation, railroads, roads, schools, and wastewater.

The ASCE Ohio Council estimates that an investment in infrastructure renewal of more than $46 billion is needed over the next five years to address the state’s crumbling infrastructure.

This assessment of Ohio’s infrastructure follows the January 28, 2009 national release by ASCE of its fourth Report Card for America’s Infrastructure, The 2009 Report Card for America’s Infrastructure. This report card, like its predecessors, was designed to provide a grade for the current condition of components of America’s crumbling infrastructure, raise public awareness, stimulate debate, and propose, highlight, and promote solutions. ASCE graded the nation’s overall infrastructure condition as a D and estimated the projected cost for repairing the nation’s infrastructure as $2.2 trillion over the next five years.


ASCE has called for a renewed partnership between citizens; local, state and the federal governments; and the private sector to work together to define the most critical projects and get the support needed for immediate action.

Ohio’s infrastructure grades ranged from a high of B- for bridges to a low of D for roads. The areas of drinking water and wastewater also had low grades of D+. There are reasons for concern and need for investment in all the areas evaluated in the report. A brief summary of the assessment follows.

Aviation infrastructure in Ohio received a grade of C-. Ohio ranks third in the nation with 124 paved and lighted general aviation airports. Only 58 percent of runways, 57 percent of taxiways, and 62 percent of aprons (the area where aircraft are parked, loaded, and unloaded) meet the satisfactory condition index. These percentages are below Ohio Department of Transportation (ODOT) Office of Aviation established goals. Ohio’s commercial service airports are meeting capacity requirements. ODOT has estimated that $9.8 million a year is needed to maintain airports at their existing condition and an additional $117 million is required to provide improvements to meet the state systems goal that 85 percent of runways, 80 percent of taxiways, and 75 percent of aprons have a satisfactory rating.

Bridges in Ohio received a grade of B-. Bridges in Ohio are crucial components of one of the largest transportation systems in the United States. Many bridges in Ohio have reached their expected service life and are in need of rehabilitation or replacement. The council estimates that it would cost $3.6 billion to replace all the structurally deficient bridges and rehabilitate two-thirds of the functionally obsolete bridges in Ohio. This estimate does not include any design, roadway or land acquisition costs associated with these projects.

Dams in Ohio received a grade of C. There are more than 2,600 dams in the state of Ohio. Nearly 70 percent of dams are privately owned. There were 1,597 state-regulated dams in Ohio in 2007. Of the state-regulated dams, 33 percent are rated as being deficient. It is estimated that $309 million is required to make repairs to the 524 deficient dams in the state. As of 2007, 43 percent of Ohio’s high hazard dams had emergency action plans (EAP), a key measure in reducing the risk to the public. An EAP is a formal document that identifies potential emergency conditions at a dam and specifies pre-planned actions to be followed to minimize property damage or loss of life in the event of a dam failure.

Drinking water infrastructure in Ohio received a grade of D+. Approximately 90 percent of Ohioans receive water for daily needs from one of the more than 6,000 public water supply systems in the state. An estimated 99 percent of the burden for funding public water supply is borne by the local government agency. ASCE estimates that Ohio has $9.68 billion in drinking water infrastructure needs. The Ohio EPA Division of Drinking and Ground Water estimates that drinking water stimulus project funds will total approximately $58.5 million under the American Recovery and Reinvestment Act (ARRA). As of April 2009, the Ohio EPA had received project funding requests for more than 1,400 projects for a total of $3 billion.
Electricity infrastructure in Ohio received a grade of C+. Electric generation, transmission, and distribution systems in Ohio are satisfactory, reliability problems are relatively few and those that exist are being addressed by system improvements. However, mandates related to alternative energy and environmental protection pose problems for Ohio’s electric utilities in the future. In 2008, the Ohio legislature passed a bill that requires that 12.5 percent of energy come from alternative energy sources (including renewable, conservation and clean thermal) by 2024. Furthermore, federal regulations may have a great impact on Ohio’s electric generating capacity, as approximately two-thirds of its electricity is provided by coal. There is a strong possibility that coal-fired generation will be required to drastically reduce CO2 emissions in the future, which could impose large financial burdens on its current system.

Parks and recreation infrastructure in Ohio received a grade of C-. Park systems in Ohio provide a crucial economic element in terms of jobs and financial impact. An additional $26.5 million is needed each year to properly operate the state parks and other divisions, and an additional $29.9 million is needed annually to eliminate the maintenance backlog over the next 10 to 20 years. These same needs are also being felt at the local levels as well. Facilities at many urban recreation centers are past their expected service life and are in need of repairs or at risk of being closed for health and safety reasons. A study by Ohio State University in 2004 stated that people visiting Ohio’s state parks alone contribute an estimated $1.1 billion to the state’s economy annually.

Railroads in Ohio received a grade of C-. Railroads provide critical services to industries important to Ohio’s economy, hauling raw materials, parts and finished products. Railroads are also an important industry in Ohio, employing more than 8,000 workers and paying approximately $500 million in wages in the state. ODOT has estimated that the cost to improve the 30 worst railroad choke points in the state would cost $1.19 billion. There are nearly 16,000 railroad crossings within the state. Since 1990, motor vehicle/train crashes at grade crossings have declined 66 percent and the number of fatalities has dropped 77 percent. However, between 2005 and 2008 there were still 482 accidents, including 45 fatalities. Columbus is the second largest and Dayton the sixth largest city in the U.S. without passenger rail services.

Roads in Ohio received a grade of D. With over 125,000 miles of roads, Ohio has one of the largest and most utilized roadway networks in the United States. ASCE found that 43 percent of Ohio’s roads are in critical, poor or fair condition. It is estimated that by the year 2014, Ohio will have a highway budget shortfall of more than $10 billion at the state government level alone. Congestion in the large urbanized areas in Ohio is getting worse. Each year, the Texas Transportation Institute (TTI) publishes a ranking of highway congestion in the 50 largest urban areas throughout the U.S., as ranked by hours of delay per person. In 2002, Columbus was ranked 41st nationally and was the only Ohio city included. By 2005, Columbus’ ranking rose to 34th, and Cincinnati and Cleveland joined Columbus as Ohio cities included on the list (ranked 40th and 49th, respectively).

School infrastructure in Ohio received a grade of C. The quality of schools in Ohio is crucial to the state’s long-term viability and ability to compete in the global marketplace. The American Federation of Teachers (AFT) estimated in 2008 that Ohio schools require $9.32 billion in infrastructure investment. This ranks Ohio 6th in the country for total funds needed. The Ohio School Facilities Commission (OSFC) was created in 1997 as a separate state agency to oversee the rebuilding of Ohio’s public schools in 614 school districts. During the 1998-2007 fiscal years, the OSFC managed yearly appropriations across all its programs totaling $5.92 billion, or approximately $592 million per year. In 2007, the OSFC reported that all facility needs in 123 school districts have been fully addressed.

Wastewater infrastructure in Ohio received a grade of D+. Aging systems discharge billions of gallons of untreated wastewater into U.S. surface waters each year. An estimated 95 percent of the burden for funding municipal wastewater treatment systems is borne by local government. It is estimated that Ohio has $11.16 billion in wastewater infrastructure needs. It is clear that operations, maintenance and capital investments in wastewater treatment facilities are not keeping up with the decaying infrastructure and the increasing demand placed on these facilities. Older systems that mingle storm and wastewater collection systems are plagued by chronic overflows during major rainstorms and heavy snowmelt, which results in the discharge of raw sewage into surface waters. The U.S. Environmental Protection Agency (EPA) estimated that the volume of combined sewer overflows discharged nationwide is 850 billion gallons per year. According to the EPA, sanitary sewer overflows, caused by blocked or broken pipes, resulted in the release of as much as 10 billion gallons of raw sewage annually.

ASCE’s Board of Directors has been giving special attention to improving America’s infrastructure on several fronts, including championing the need for investments in infrastructure renewal with policy makers at the national, state and local level. As part of this effort, and to broaden the dialog on infrastructure renewal, ASCE has been encouraging its Sections and Branches to develop and promote Infrastructure Report Cards for their region, state and city or county. Sections and Branches can localize the national Report Card by focusing on infrastructure that is relevant to their region, state, or local area.

OHIO

Top Three Infrastructure Concerns:

  1. Roads
  2. Bridges
  3. Drinking Water

Key Infrastructure Facts

  • 27 percent of Ohio’s bridges are structurally deficient or functionally obsolete.
  • There are 375 high hazard dams in Ohio. A high hazard dam is defined as a dam whose failure would cause a loss of life and significant property damage.
  • 524 of Ohio’s 1,597 dams are in need of rehabilitation to meet applicable state dam safety standards.
  • 57 percent of high hazard dams in Ohio have no emergency action plan (EAP). An EAP is a predetermined plan of action to be taken including roles, responsibilities and procedures for surveillance, notification and evacuation to reduce the potential for loss of life and property damage in an area affected by a failure or mis-operation of a dam.
  • Ohio’s drinking water infrastructure needs an investment of $9.68 billion over the next 20 years.
  • Ohio ranked 5th in the quantity of hazardous waste produced and 3rd in the total number of hazardous waste producers.Ohio’s ports handled 124 million tons of waterborne traffic in 2005, ranking it 6th in the nation.
  • Ohio reported an unmet need of $3.3 million for its state public outdoor recreation facilities and parkland acquisition.
  • 25 percent of Ohio’s major roads are in poor or mediocre condition.
  • 45 percent of Ohio’s major urban highways are congested.
  • Vehicle travel on Ohio’s highways increased 27 percent from 1990 to 2007.
  • Ohio has $11.16 billion in wastewater infrastructure needs.

To see the ASCE 2009 Report Card state-by-state assessment and how your state’s infrastructure measures up, click here.

Note: The Ohio Council of Local Sections of ASCE is the body that addresses statewide issues and shares ideas and practices from the six ASCE Sections in Ohio. The Ohio Council is composed of delegates elected annually from each of the six Sections: Akron/Canton, Central Ohio, Cincinnati, Cleveland, Dayton, and Toledo. The Ohio Council in 2008 formed a committee to prepare an Infrastructure Report Card for the State of Ohio. The 2009 Ohio Infrastructure Report Card is the result of that effort. Please access or print a copy of the 2009 Ohio Infrastructure Report Card by visiting the Ohio Council of Local Sections of ASCE website at http://www.ohioasce.org/reportcard.

Bob Keaton

Rough Roads Ahead

May 22, 2009

America’s $1.75 trillion public highway system is in jeopardy. Years of wear and tear, non-stop traffic, an increased use of heavy trucks, deferred maintenance, harsh weather conditions, and rising construction costs have taken their toll on America’s roads.

Driving on rough roads costs the average American motorist approximately $400 a year in extra vehicle operating costs. Drivers living in urban areas with populations over 250,000 are paying upwards of $750 more annually because of accelerated vehicle deterioration, increased maintenance, additional fuel consumption, and tire wear caused by poor road conditions.

Rough Roads Ahead: Fix Them Now or Pay for It Later, a report released by the American Association of State Highway and Transportation Officials (AASHTO) and The Road Information Program (TRIP), identifies the conditions of the nation’s major highways, costs to preserve the highway system, added costs to motorists due to poor pavement, and state solutions to shore up their highways. The report states that one-third of the nation’s major highways, including Interstates, freeways and major roads, are in poor or mediocre condition. Roads in urban areas, which carry 66 percent of the traffic, are in much worse shape.

Delayed and deferred maintenance leads to higher repair and reconstruction costs—pay me now or pay me more, lots more, later.

According to Kirk Steudle, director of the Michigan Department of Transportation (MDOT), “The American people are paying for rough roads multiple times. Rough roads lead to diminished safety, higher vehicle operating costs and more expensive road repairs. It costs $1 to keep a road in good shape for every $7 you would have to spend on reconstruction. It’s another drag on the economy.”

While the American Reinvestment and Recovery Act (ARRA) will provide $27 billion for highway projects, that money will barely make a dent in highway maintenance, preservation and reconstruction needs. The recent AASHTO Bottom Line report documented the need for all levels of government to invest $166 billion each year in highways and bridges. More than half of that amount would be needed for system preservation. “The federal stimulus program is providing a helpful down payment towards repairing some of the nation’s rough roads,” said Frank Moretti, TRIP’s director of Policy and Research. “But it will take a significant long-term boost in investment by all levels of government to provide Americans with a smooth ride.”
Saving America’s highways demands more than short- term stimulus funds and quick fixes based on available funding. It will require a greater and smarter investment of transportation dollars to ensure a new and better transportation program.

This report examines the condition of America’s roads and what it will take to save them:

What’s Wrong with Our Roads?
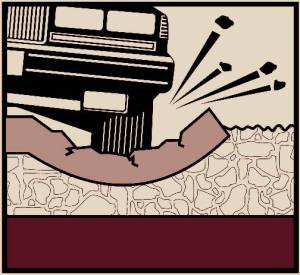
Killer potholes. In a flash they can dislodge a hubcap, shred a tire, or even worse, cause a driver to lose control of a car. But they can also be a symptom of a much deeper problem —deteriorating pavement that takes much more to repair than a simple patch.

As fundamental as our transportation system is to our daily lives, our highways and bridges are aging, under-funded and inadequate to meet the demands we place upon them today, much less the future. And across America motorists are paying the price.

For state departments of transportation, preserving the condition and performance of the transportation system we have built is the top priority.

In Pennsylvania, for example, work will begin later this year on more than 240 projects to repair and improve 608 miles of highway and 399 bridges. The projects will be financed with $1 billion in federal economic-stimulus money combined with about $2 billion in federal and state funds. This represents the most the Pennsylvania Transportation Department has ever committed to construction in a single year.

New technology, materials, and procedures are helping extend the life of our highways and bridges. States are also spending “smart” by making the investments needed to keep a road in good repair, rather than paying more later to address greater deterioration.

But the needs are enormous and poor-quality pavement is reflected in the increased operating costs that motorists must pay.

This report, developed by AASHTO in conjunction with TRIP, a national transportation research group, documents the preservation needs of the nation’s highways and the solutions that can be applied. As we look to the next authorization of federal-aid surface transportation programs, rebuilding and improving our nation’s core transportation structure must be a fundamental goal.

Allen D. Biehler
Secretary, Pennsylvania Department of Transportation
President, AASHTO

ROUGH ROADS LEAD TO HIGHER COSTS
Only half of the nation’s
major roads are in good condition, based on an analysis of recent Federal Highway Administration data. The situation is worse in high traffic, urban areas where one in four roads is in poor condition. In some major urban centers, more than 60 percent of roads are in poor condition.

The American public pays for poor road conditions twice — first through additional vehicle operating costs and then in higher repair and reconstruction costs. For the average driver, rough roads add $335 annually to typical vehicle operating costs. In urban areas with high concentrations of rough roads, extra vehicle operating costs can be as high as $746 annually.

Sustaining deteriorating roads costs significantly more over time than regularly maintaining a road in good condition. Costs per lane mile for reconstruction after 25 years can be more than three times the costs of preservation treatments over the same 25-year period.

CHALLENGES FACING AMERICA’S HIGHWAYS
Unrelenting traffic is tough on roads. Traffic growth has far outpaced highway construction, particularly in major metropolitan areas. The number of miles driven in this country jumped more than 41 percent from 1990 to 2007—from 2.1 trillion miles in 1990 to 3 trillion in 2007. Nearly 66 percent of that driving passed over urban roads, which are showing the most wear and tear. In some parts of the county, dramatic population growth has occurred without much of an increase in road capacity, placing enormous pressure on roads that, in many cases, were built 50 years ago.

Soaring construction costs during the past five years are straining state and local budgets. By the summer of 2008, asphalt prices were up 70 percent, concrete 36 percent, and steel 105 percent. Diesel fuel, used to operate heavy construction equipment, soared 305 percent, including a 63 percent jump in one year. Over time, these higher costs have eroded states’ purchasing power on construction projects. In the past few months, however, the economic recession appears to have moderated some of these costs. In fact, many bids for stimulus projects are coming in below engineers’ estimates.

The explosion of freight truck traffic is punishing aging highways. The Interstate system is bearing the brunt of truck traffic and showing the impact. Today, on average, every mile of Interstate highway sees 10,500 trucks a day. More than 80 percent of freight tonnage moving across the United States is carried by trucks driving on the 50-year-old Interstate system.

Managing a highway system is like playing chess. You have to look at the whole board, the whole system, not just the next move. Sure we do reactive things, but our best strategy is when we look down the road eight years or more, look at every section of road, and budget to keep those roads in good condition.
—Gary Ridley, Director, Oklahoma Department of Transportation

Investment has not kept up with maintenance and preservation needs. Michigan DOT Director Kirk L. Steudle said, “It is important to slow the rate of decline in the good road so that it stays in good shape rather than slipping into fair or poor condition.” But soaring construction costs, tight budgets, and increasing needs make it hard for states to sustain preservation programs. That is why most states are using their stimulus funds to make up for lost time from deferred maintenance and preservation.

Highway Maintenance Needs Exceed Available Funds
Keeping good roads in good condition is the most cost-effective way to save America’s highways. But the needs are high and the available funding limited. For example:

  • Oregon needs $200 million annually over the next 10 years to maintain roads at the current levels. It has $130 million available annually.
  • Texas needs $73 billion during the next 22 years to maintain current conditions. The Department is spending $900 million per year and losing ground.
  • Rhode Island needs $640 million annually to preserve its highway system and has only $354 million available each year.

Stimulus funds will fill in some of the gaps.

  • Oregon will use half of its $224 million of stimulus funds for pavement resurfacing and preservation projects.
  • Texas is spending $800 million in stimulus funds to stabilize pavement and bridge conditions for the next few years.
  • Rhode Island will use its $137 million primarily for preservation and maintenance projects. The extra funds provide about 5 percent of the projected shortfall in preservation funds over the next 10 years.
  • South Dakota’s stimulus allocation will provide about one year’s worth of preservation funding to help with the backlog of needs.

Strategies For Saving America’s Highways
Use the best materials throughout the life of a road. From filling a pothole to reconstructing a major highway, using materials designed to meet specific climate and traffic conditions will extend the service life of a road and reduce costs over the long run. Research into new materials, constant monitoring of pavement conditions, and matching materials to traffic and weather conditions all contribute to long-term durability of a road.

Keep good roads good. Maintaining a road in good condition is easier and less expensive than repairing one in poor condition. Achieving that goal involves a carefully planned and consistently funded pavement preservation program that makes proactive improvements in good roads to keep them good. “You can spend too much time and money chasing after potholes while watching the system fall farther and farther behind,” said Pennsylvania DOT Secretary Allen Biehler.

Create a Multi-Modal Freight Strategy. Ensuring that roads can handle the projected growth in freight bearing trucks involves more than building sturdier roads. It will require a commitment to a multi-modal freight strategy that may include: (1) building a network of dedicated truck lanes; (2) expanding rail capacity to sustain its share of freight movement; (3) fixing bottlenecks and reducing congestion in metropolitan areas; (4) improving conditions from ports and distribution centers to the Interstate and rail systems; and (5) a funding model that includes freight-related user fees to implement the strategy.

View highways as public assets to be managed rather than projects to be fixed. Asset management is a comprehensive approach to ensuring the most cost-effective return on investments for operating, maintaining, upgrading, and expanding transportation systems. It starts from the assumption that the nearly 4 million miles of public roads are a valuable national asset, essential to the vitality of the American economy.

Invest to save America’s highways. When the Interstate system was first designed in the 1940s, lines were put on a map to describe the vision for a country connected by a network of limited access highways. “Planners said this is what we want it to look like. Now let’s figure out how to pay for it,” said Oklahoma DOT Director Ridley. “Now we work in the reverse. We say here’s how much money we have, and let’s decide what we want to do with that. That approach doesn’t produce the best decisions.” Rebuilding for the future requires a national commitment to significant and sustained investment in transportation infrastructure based on a vision of what we want our transportation system to look like in the 21st century and beyond.

It is time for a greater and smarter investment of transportation dollars to ensure a new and better transportation program.

Are we there yet? No—but we can be.

We as stewards of the transportation system have no choice but to drive home the message that maintaining an acceptable condition for our highways—preserving the system—is vital to our country’s future.
Allen D. Biehler, AASHTO President; Secretary, Pennsylvania Department of Transportation

Highways to Everywhere

A well-connected highway system, maintained in good condition, is critical to the nation’s economy. With a current value of $1.75 trillion, preserving the system of roads and highways so they last for generations and meet changing needs should be a top priority for all levels of government. Even with continued growth in public transit, enhanced rail services, and a national commitment to reduce greenhouse gas emissions from vehicles, roads remain a vital component of the system that moves people and goods throughout the country.

Roads are essential to everyday life.

  • Nearly 24 million children—55 percent of the country’s kindergarten through high school population—ride 450,000 school buses 180 days per year.
  • Every year, 50,000 ambulances make 60 million trips—that is an average of 164,000 trips per day.
  • A fire department responds in one or more vehicles to a fire alarm in the United States every 20 seconds.
  • Trucks in the United States carry 32 million tons of goods valued at $25 billion every day.
  • The country’s 240 million registered vehicles travel more than 2.9 trillion miles annually.

Those vehicles and the people who drive and ride in them, rely on the nation’s nearly 4 million miles of public roads—from Interstate highways to neighborhood streets—to get somewhere to do something.

Highways are a backbone of American life connecting people, goods, and services. But many roads, particularly in metropolitan areas and population growth centers, are in poor condition.

Despite the recent downturn in travel in 2008, the number of miles driven on the nation’s roadways has increased 41 percent from 1990 to 2007. Large commercial truck traffic, which places significant stress on pavements, has increased 50 percent during the same timeframe.

In some parts of the country, dramatic population growth with minimal capacity expansion has placed enormous pressure on highways. For example, in Utah, between 1990 and 2007, population grew by 47 percent and miles driven by 71 percent—but highway capacity grew by only 4 percent.

Transportation officials across the country are focusing on how to preserve and protect their part of this national asset by building smarter, investing in systematic maintenance programs, and using new technologies to produce longer-lasting roads.

Quick Facts:

  • One-third of the nation’s highways – interstates, freeways and major roads – are in poor or mediocre condition.
  • More than one-quarter of major urban roads, which carry the brunt of national traffic, are in poor condition.
  • Major urban centers have the roughest roads – more than 60 percent of the roads in the greater Los Angeles, San Jose, San Francisco-Oakland, Honolulu and Washington, DC, areas offer a poor ride.
  • Rough roads add an average of $335 to the annual cost of owning a car – in some cities an additional $740 more – due to damaged tires, suspensions and reduced fuel efficiency.
  • Every $1 spent in keeping a good road good precludes spending $6-$14 to rebuild one that has deteriorated.

THE NATION’S HIGHWAYS BY THE NUMBERS
Total miles of public roads—3,967,159

Total miles of roads by ownership

  • Federal—128,378 miles (3.2 percent)
  • State—783,643 miles (19.8 percent)
  • Local—3,055,138 miles (77 percent)

Total miles of rural and urban roads

  • Rural – 2,939,042 (74 percent)
  • Urban – 1,028,107 (26 percent)

Total Interstate Highway miles—47,000
Annual miles driven in cars and trucks—2.9 trillion
Percent of miles driven on urban roads—65.6 percent
Tons of freight moved on America’s highways annually—15 billion

EARLY HISTORY OF UNITED STATES ROAD BUILDING
1625
Earliest known paved American road—Pemaquid, Maine
1795 First engineered American road— Philadelphia to Lancaster toll turn-
pike
1823 First macadam road constructed in America—Maryland
1872 First asphalt paved roads in North America—Pennsylvania Avenue in
Washington, DC, and Fifth Avenue in New York, NY
1893 First rural brick road—Ohio
1906 First bituminous macadam road— Rhode Island Hammond Surface Streets,
Hammond, Indiana

Note: The full report is available at: http://www.tripnet.org/RoughRoadsReport_May2009.pdf or http://roughroads.transportation.org. AASHTO is the “Voice of Transportation” representing State Departments of Transportation in all 50 states, the District of Columbia and Puerto Rico. A nonprofit, nonpartisan association, AASHTO serves as a catalyst for excellence in transportation. TRIP is a national highway research group based in Washington, DC. Rough Roads is part of Are We There Yet? We Can Be!, AASHTO’s effort to build awareness and support for the nation’s transportation system.

Greg Sitek

Daily Dirt

May 21, 2009

EPA Head Visits Wyoming Wind Farm

The relatively nascent U.S. wind industry can help propel the country out of its economic doldrums and bring energy independence, Environmental Protection Agency (EPA) Administrator Lisa Jackson said.

While touring Happy Jack Windpower, a new 30 MW windpower facility west of Cheyenne, WY, Jackson said wind energy will benefit Wyoming and the rest of the nation by creating jobs to build and maintain wind farms.

Happy Jack Windpower was developed by Duke Energy Generation Services. The fourteen Suzlon turbines operate at 2.1 MWs each. The project generated its first MW of electricity on July 17, 2008 with a commercial operations date of September 3, 2008 and sells 100 percent of its clean, renewable energy to Cheyenne Light Fuel & Power under a 20-year renewable energy purchase agreement. Happy Jack Windpower will generate approximately 100,000,000 kWhs of electricity per year — enough to power approximately 12,000 homes.

“In a thriving wind power industry, turbines like the ones here will be designed, manufactured, constructed and maintained by Americans,” she said. “For American workers that creates new jobs, especially manufacturing jobs in communities all across our country.”

At the invitation of Wyoming Governor Dave Freudenthal (D), Jackson began a two-day tour of the state’s energy industry at the wind farm. Today, Jackson will tour Wyoming coal and natural gas fields.

Illinois Senate Passes $29 Billion Public Works Program

On Wednesday, the Illinois Senate voted to legalize video poker, boost liquor taxes and allow lottery wagering over the Internet to fund a $30 billion statewide capital infrastructure program. The funding will be used for the repair of the state’s aging roads and bridges, making them safer while creating thousands of jobs to stabilize the state’s ailing economy.

“Many roads, bridges and other projects in the 22nd District have been in urgent need of renovation for years. By first ensuring the funding for this program, we can then move forward with a capital plan, putting people to work while shoring up our crumbling infrastructure,” Senator Michael Noland (D-Elgin) said. “With this program, we will be able to put thousands of people to work making our roads safer while putting good wages in the pockets of working people. These people will then be able to spend more money in our stores, pay off their mortgages and generally increase commerce everywhere.”

Illinois has not had a comprehensive capital improvement plan in a decade. Over the course of those ten years, many bridges and roads around the state have fallen into disrepair. By passing an infrastructure improvement program now, Illinois will be able to capture billions more in federal dollars to assist in fixing the continuing problem of its deteriorating transportation network.

In January, when Illinois Senate President John Cullerton (D-Chicago) was first elected to lead the supermajority of Democrats, he pledged to establish and pass a major capital construction program. Over the course of the past several weeks, Cullerton has engaged Senate Republicans and leaders from the Illinois House to develop the plan passed Wednesday.

“For the past several years, the politics of personality has interfered with developing a jobs plan that a strong majority of legislators could support,” Cullerton said. “Today, with the help of Democrats and Republicans, the House and the Senate, I am confident we will finally move forward the spark needed for our state economy. It couldn’t have been done without the commitment to work together, in good faith. I commend each legislator and each legislative leader who has helped put more Illinoisans to work.”

The capital bill, (HB 312), includes 13 billion in state funding and $7 billion in matching federal funds. On the spending side, more than $15 billion will go for road projects and $3 billion for school construction. The plan also would finally pay $148 million in school construction money owed for years to two dozen school districts throughout Illinois, including $29.7 million for Chicago schools. Higher education, parks and museums also will get funds. Chicago-area mass transit would receive $1.8 billion out of the $2 billion set aside for local bus and train service statewide. The breakdown: $900 million for the Chicago Transit Authority (CTA), $810 million for Metra commuter rail and $90 million for Pace suburban bus.

When it came to where the money would be spent and authorizing the bonds to pay for it, senators voted 59-0. The toughest vote was on whether to increase taxes and fees and expand gambling. Even that measure passed 47-12.

But Illinoisans also would pay higher fees for license plates, which will cost $79 on July 1 and would rise again to $99 under the proposal. A driver’s license, now only $10, would cost $30 under the legislation. The plan relies most heavily on so-called sin taxes. A six-pack of beer, bottle of wine or fifth of scotch will all cost more.

The agreement would legalize video gambling to take advantage of the widespread under-the-table business that thrives in Illinois, authorizing up to five poker, blackjack or video slot machines per business and taxing the proceeds for an estimated $375 million a year.

The legislation also would open up the state to selling lotto tickets over the Internet, a proposition that would need approval from the U.S. Department of Justice.

Gambling opponents spoke out against both proposals before the executive committee approved the measures on 12-0 bipartisan votes.

Before becoming law, the proposal must be approved by the House and signed by Governor Pat Quinn (D), who has signaled his openness to the plan.

Cullerton predicted the package would pass the House swiftly, perhaps as soon as Thursday.

ROAD PROGRAM INVESTMENT:

  • More than $15 billion will be invested in roads (includes state bonds and local/federal matching funds)
  • More than $11.6 billion will be directed to the state’s Multiyear Road Program
  • $3 billion will be invested in new road projects
  • $500 million will be directed to new local transportation projects

EDUCATION INFRASTRUCTURE INVESTMENT:

  • Illinois will receive a 100% local/federal match for school construction and maintenance investment. House Bill 312 directs $1.6 billion to school construction and maintenance, garnering another $1.6 billion from non-state investment
  • More than $1 billion will be directed to state universities
  • Community Colleges will gain $353 million

ENVIRONMENTAL/ENERGY/TECHNOLOGY INVESMENTS:

  • More than $1.9 billion will be invested in environmental, energy and technology projects. More than $1.2 billion of this commitment comes from local and federal dollars, or 65% of the overall investment
  • Illinois will invest more than $900 million in clean water and sewer programs through this bill. $110 million in state investment, garnering $796 in local and federal commitments
  • Parks, libraries and museums are slated to receive $500 million in the authorization

MASS TRANSPORTATION INVESTMENTS:

  • $4.66 billion will be directed to public transit programs. 90% of these funds will be spent on the Regional Transportation Authority (RTA), CTA and Metra
  • In sum, almost $6 billion will be invested in transportation investment throughout Illinois

STATE FACILITIES & ECONOMIC DEVELOPMENT INVESTMENTS:

  • $750 million of investment is authorized for state facility improvements. These investment dollars will be directed to improve aging state buildings and public service facilities.
  • $50 million will be used for new investments in health care facilities.

Mimi Sitek